
While the presidential race has tightened, the possibility of Donald Trump being defeated by a wide margin has some Republicans worried about their odds of retaining control of Congress. However, only a handful of Republican-controlled districts are vulnerable. Speaker Paul Ryan’s job security and continuing GOP control of the House is almost assured, even if Democrats win a majority of the national Congressional vote. How is it that the chamber supposedly responsive to “The People Alone” can be so insulated from popular sentiment? It is well known that the Republican Party has a competitive advantage in the House because they win more seats by narrow margins, and thus have more efficiently distributed voters. What is poorly understood is how the current level of observed bias favoring the GOP was the result of political choices made by those drawing district boundaries.
This is a controversial claim, one that is commonly challenged. However, in Gerrymandering in America: The House of Representatives, the Supreme Court, and the Future of Popular Sovereignty, a new book co-authored by Anthony J. McGann, Charles Anthony Smith, Alex Keena and myself, we test several alternative explanations of partisan bias and show that, contrary to much professional wisdom, the bias that insulates the GOP House Majority is not a “natural” result of demographic sorting or the creation of “majority-minority” districts in compliance with the Voting Rights Act of 1965. It is the result of unrestrained partisan gerrymandering that occurred after the 2010 Census, and in the wake of the Supreme Court’s 2004 decision in Vieth v Jubelirer, which removed legal disincentives for parties to maximize partisan advantage in the redistricting process.
Partisan bias tripled after congressional redistricting
We measure partisan bias using the symmetry standard, which asks: What if the two parties both received the same share of the vote under a given statewide districting plan? Would they get the same share of seats? If not, which party would have an advantage?
We calculate seats/votes functions on the assumption of uniform partisan swing – if a party gains 5% nationally, it gains 5% in every district, give or take an allowance for local factors (simulated through random effects that reduce our estimates of bias). Linear regressions provide an estimate of what level of support the Democrats expect to win in each district if they win 50% of the national vote, given the national level of support for the party in actual elections, and we generate a thousand simulated elections with hypothetical vote swings and different random local effects for each district, to create our seats/votes functions.
Figure 1: Seats/Votes function for Congress 2002-2010
 //embedr.flickr.com/assets/client-code.js
Figure 2: Seats/Votes function for Congress 2012

Figures 1 and 2 show the seats/votes functions under the 2002-2010 Congressional districts, and the 2012 post-redistricting districts, respectively. We observe a 3.4% asymmetry in favor of Republicans under the older districts. This is still statistically significant, but it is only about a third of the 9.39% asymmetry we observe in 2012. Graphically, the seats/votes function in Figure 1 comes far closer to the 50%votes/50%seats point. The bias at 50% of the vote is less than 2% under the older state districting plans, compared to 5% in 2012. That is, if the two parties win an equal number of votes, the Republicans will win 55% of House seats. Furthermore, the Democrats would have to win about 55% of the vote to have a 50/50 chance of winning control of the House in 2016. Thus it is not impossible that the Democrats will regain control of the House, but it would take a performance similar to or better than 2008, when multiple factors were favorably aligned for the Democrats.
Increased bias did not result from “The Big Sort”
Perhaps the most popular explanation for increased partisan bias comes from the “Big Sort” hypothesis, which holds that liberals and conservatives have migrated to areas dominated by people with similar views. Specifically, because Democrats tend to be highly concentrated in urban areas, it is argued, Democratic candidates tend to win urban districts by large margins and “waste” their votes, leaving the Republicans to win more districts by lower margins.
The question we need to consider is whether the concentration of Democratic voters has changed relative to that of Republican voters since the previous districts were in place. In particular, if it is the case that urban concentration causes partisan bias, then we would expect to find relative Democratic concentration increasing in those states where partisan bias increases. In order to address this question, we measure the concentration of Democratic voters relative to that of Republicans with the Pearson moment coefficient of skewness, using county-level data from the 2004 and 2012 presidential elections. As shown in Table 1, in most states the level of skewness toward the Democrats actually decreased in 2012.
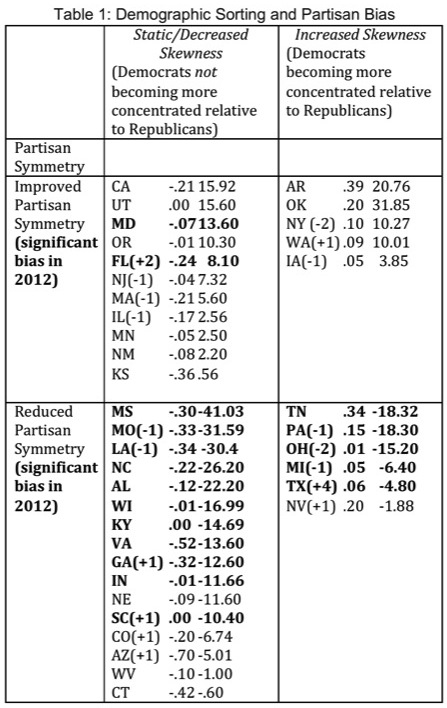
In twenty-seven out of the thirty-eight states with at least three districts, the relative concentration of Democratic voters compared to Republican voters declines. Moreover, in those states where partisan bias increased between the 2000 and 2010 districting rounds, those with an increase in skewness are outnumbered by those where there was no increase in skewness, by more than two to one. We also find that there was reduced skewness in most of the states where there was statistically significant partisan bias in 2012.
Of course, we should not conclude that geographical concentration does not make it easier to produce partisan bias. North Carolina was able to produce a highly biased plan without the benefit of a skewed distribution of counties, but to achieve this, the state Generally Assembly had to draw some extremely oddly shaped districts. While the urban concentration of Democratic voters makes producing districting plans biased toward the Republicans slightly easier, it makes producing pro-Democratic gerrymanders very hard. In Illinois, the Democratic-controlled state legislature drew some extremely non-compact districts but still only managed to produce a plan that was approximately unbiased between the parties.
Increasing racial diversity does not require partisan bias
Another “natural” explanation for partisan bias, one that is especially popular among Southern GOP legislators, is that that it is impossible to draw districts that are unbiased while at the same time providing minority representation in compliance with the Voting Rights Act of 1965. The need to draw more majority-minority districts, it is argued, disadvantages the Democrats because it forces the inefficient concentration of overwhelmingly Democratic minority voters.
There are four states with four or more majority-minority districts – California, Texas, Florida, and New York – and they account for more than 60% of the total number of majority-minority districts. Of these, Texas and Florida have statistically significant partisan bias, but California, Illinois, and New York do not, so the need to draw majority-minority districts does not make it impossible to draw unbiased districting plans. Yet many of the states that saw partisan bias increase do have majority-minority districts – or rather a single majority-minority district in most cases. It is possible that packing more minority voters into existing majority-minority districts creates partisan bias.
To test this possibility, we subtract the average percentage of African-Americans and Latinos in districts where those races made up a majority of the population in the 110th Congressional districts from the 113th Congress averages. Figures 3 and 4 display the results for these states. For majority-Latino districts, we find no evidence that states with increased Latino density have more biased redistricting plans.
Figure 3: Majority-Latino District Density Change and Symmetry Change

Figure 4: Majority-Black District Density Change and Symmetry Change

By contrast, states with increased majority-Black densities have clearly adopted more biased districting plans. Among the states with substantial reductions in partisan symmetry, only Louisiana (−1.9 %), Ohio (−1.0 %), and Pennsylvania (−0.9 %) had lower average percentages of African Americans in their majority-minority districts after redistricting. The three states with the largest increases in majority-Black district density, Tennessee (5.2 %), North Carolina (2.4 %), and Virginia (2.2 %), include some of the most biased plans in the country. This is not in any way required by the Voting Rights Act – indeed, it reduces the influence of African-American voters by using their votes inefficiently. However, it is consistent with a policy of state legislatures seeking partisan advantage by packing African-American voters, who overwhelmingly vote for the Democratic Party, into districts where the Democratic margin will be far higher than necessary.
Demography is not destiny
The bias we observe is not the inevitable effect of factors such as the urban concentration of Democratic voters or the need to draw majority-minority districts. It is for the most part possible to draw unbiased districting plans in spite of these constraints. Thus if state districting authorities draw districts that give a strong advantage to one party, this is a choice they have made – it was not forced on them by geography. The high level of partisan bias protecting GOP House control can only be explained in political terms. As we show in our book, Pro-Republican bias increased almost exclusively in states where the GOP controlled the districting process.
One of the immediate consequences of unrestrained partisan gerrymandering is that, short of a landslide Democratic victory resembling 2008, the Republicans are very likely to retain control of the House. But one of the more profound consequences is that redistricting has upended one of the bedrock constitutional principles, popular sovereignty. Without an intervention by the courts, political parties are free to manipulate House elections to their advantage without consequence.

What, if anything, does your research show about the impact of independent redistricting commissions gerrymandering? I’d always found the Big Sort argument counter-intuitive because it required as premise that bad behaviour by bad actors have absolutely zero impact on the electoral system.
LikeLike
We demonstrate that gerrymandering was most severe where parties had the capacity (unified control of the redistricting process) and the motivation (competitiveness in congressional/national races). Redistricting commissions produced some of the least biased plans in the country, including plans like California’s, where there are significant geographic partisan concentrations.
LikeLike
Zing!
LikeLike
Baudelaire was obviously thinking of the US redistricting system when he wrote: ‘The finest trick of the devil is to persuade you that he does not exist.’
LikeLike
“from Maine westward to the Pacific Ocean, in the last ten years, in no state whatever had there been an honest and fair district apportionment bill passed for the election of members of Congress [except] where two branches of a legislature were divided in political opinion, and one checked the other.”
—Henry Droop (1869), quoting Senator Charles Buckalew of Pennsylvania.
LikeLike
“This is a controversial claim, one that is commonly challenged.” In academia, maybe (I’m not an academic and don’t know). But on NPR and in other haunts of the politically literate outside of academia, it is the conventional wisdom.
LikeLike
Perhaps almost exclusively in academia! But not without some justification, as it is certainly true that geographically sorted voters make it more difficult to draw unbiased plans.
LikeLike
Why is this so, however? Does logic not dictate that the less competitive the districts, the more proportional the result? Or is that correlation too weak in this context?
LikeLike
Jd
I couldn’t possibly discuss the mathematics but there is a point at which gerrymandering simply becomes ineffectual because the gerrymandering party has spread its own support so thinly that it can no longer win a majority of districts. This happened in both South Australia and Queensland. However until a gerrymander reaches that tipping point it can entrench the party of power very effectively. The gerrymander’s impact is not a smooth slope.
The ABC reported one Queensland general election in the 1980s as the government being returned with a reduced minority.
LikeLike
Alan, that is true, but does not really answer my question; I think that’s my fault for not clearly stating that I was responding to the theory that “geographically sorted voters make it more difficult to draw unbiased plans”.
I didn’t know that gerrymandering used to happen in Australia; I was only aware of malapportionment.
LikeLike
How robust is the model in the face of violations of the “assumption of uniform partisan swing – if a party gains 5% nationally, it gains 5% in every district, give or take an allowance for local factors (simulated through random effects that reduce our estimates of bias)”? Suppose such local factors are not random but are instead linked to attributes of voters that are in turn linked to geographic sorting?
And a second question. Is it realistic to assume that districting schemes do not influence the statewide percentage for each party (as well as the number of districts each party wins)? If it’s true that voters have an unconscious bias toward supporting the predicted winner (i.e., winner in their district), then isn’t this assumption suspect? Again, to what extent does your conclusion depend on it?
LikeLike
We have not ran simulations with alternative district vote swings, but in the cases where we find substantial bias in competitive states, the estimates are not close, in that they are robust far beyond standard levels of statistical significance. There are programs that allow for more complex models, however. In addition, while there are many factors that could influence voter behavior under different districting conditions, we would be skeptical of models that incorporate incumbency or other district-levels factors which should be treated as endogenous. Our interest is not in district level behavior, but rather in how the districting scheme mechanically translates a hypothetical uniform change in support across districts into a change in seats.
LikeLike
Pingback: Hillary Clinton will win, but don’t celebrate: GOP control of Congress is baked in for years to come « WORDVIRUS
Pingback: Hillary Clinton will win, but don’t celebrate: GOP control of Congress is baked in for years to come | Salon
Pingback: Republicans will likely keep their House majority – even if Clinton wins by a landslide – and it’s because of gerrymandering. – michael latner
Apparently the Republicans won the House popular vote…? Wikipedia has the GOP on 49.1% to the Democrats’ 48%. At first I thought this must be thanks to heavily-Democratic uncontested seats, but from what I saw there were at least as many Republican uncontested seats as Democratic ones. Does anyone have data to challenge this?
LikeLike
The importance of gerrymandering, relative to other factors, is an issue that isn’t going away anytime soon. The most recent salvo from the other side is from Jowei Chen and David Cottrell. Hat tip to Richard Pildes for writing about this study.
I no longer have (if I ever did) the methodological chops to evaluate the research published by either side. Very uncomfortable position to be in, because I want Chen and Cottrell to be right as a purely practical matter. The fact that so many pundits and activists believe gerrymandering to be the only problem that needs solving is an important obstacle to starting any meaningful discussion of PR in the United States.
LikeLike
It is a very exciting time to be engaged in this literature Bob. I might add that our book demonstrates that one need not be a methodologist to understand what is at work here, our standard for assessing gerrymanders can be calculated in an Excel spreadsheet!
LikeLike
Chen and Cottrell, using 2008 voting patterns, compared seat expectations for real 2012 districts relative to artificial districts that might be created by a Blind Mapmaker. They find evidence for partisan gerrymandering when there is partisan control of redistricting, but claim that overall the gains by Republicans should be nearly cancelled by those of Democrats.
The assertion rests largely on putting California in the Blue camp, on the grounds that its Redistricting Commission was under Democrat influence. This is at odds with the Wikipedia article on the Commission and the 2012 congressional districting. Can someone closer to the scene comment?
LikeLike
Hi Dave, two thoughts on Chen and Cottrell, including their most recent work. One, their mapmaker is not as blind as it might seem, McDonald and Altman have shown that algorithms that incorporate compactness as a hard criteria will produce maps that pack more Democrats because of dense, urban populations. Second, California has one of the least biased plans in the country, although the disproportionality of single member districts certainly does benefit the largest party, which in thise case is the Democratic.
LikeLike